

Hawaii Visitor & Traveler Data

Hawaii Visitors by Island 2024
If it's Hawaii tourism data you're looking for, then you're in the right place. We'll cover the latest tourism trends on the Hawaiian islands and provide a series of graphics and summarized data to give you a good idea of what's happening by the numbers.
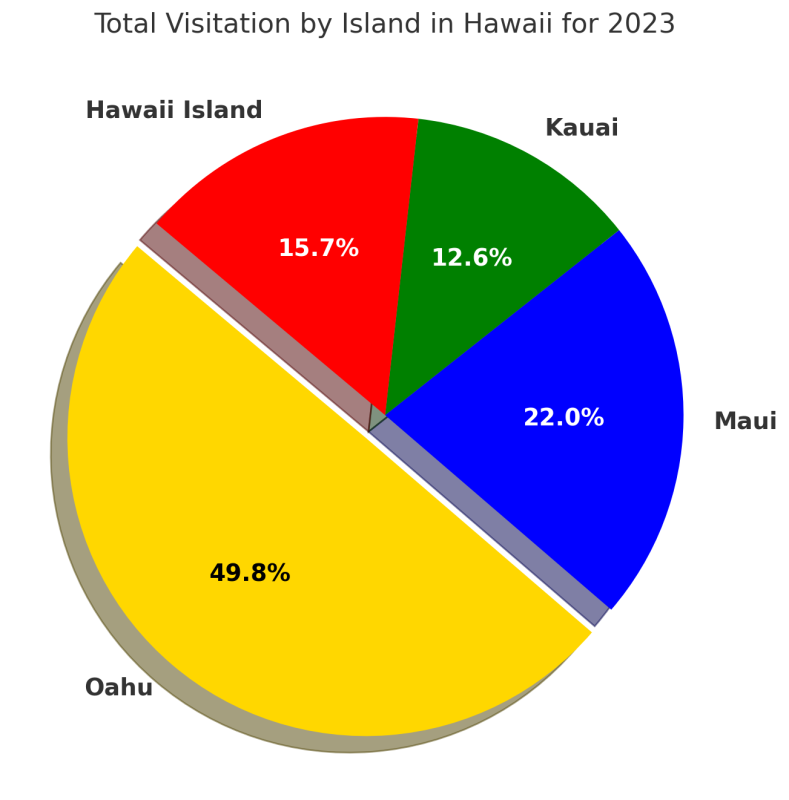
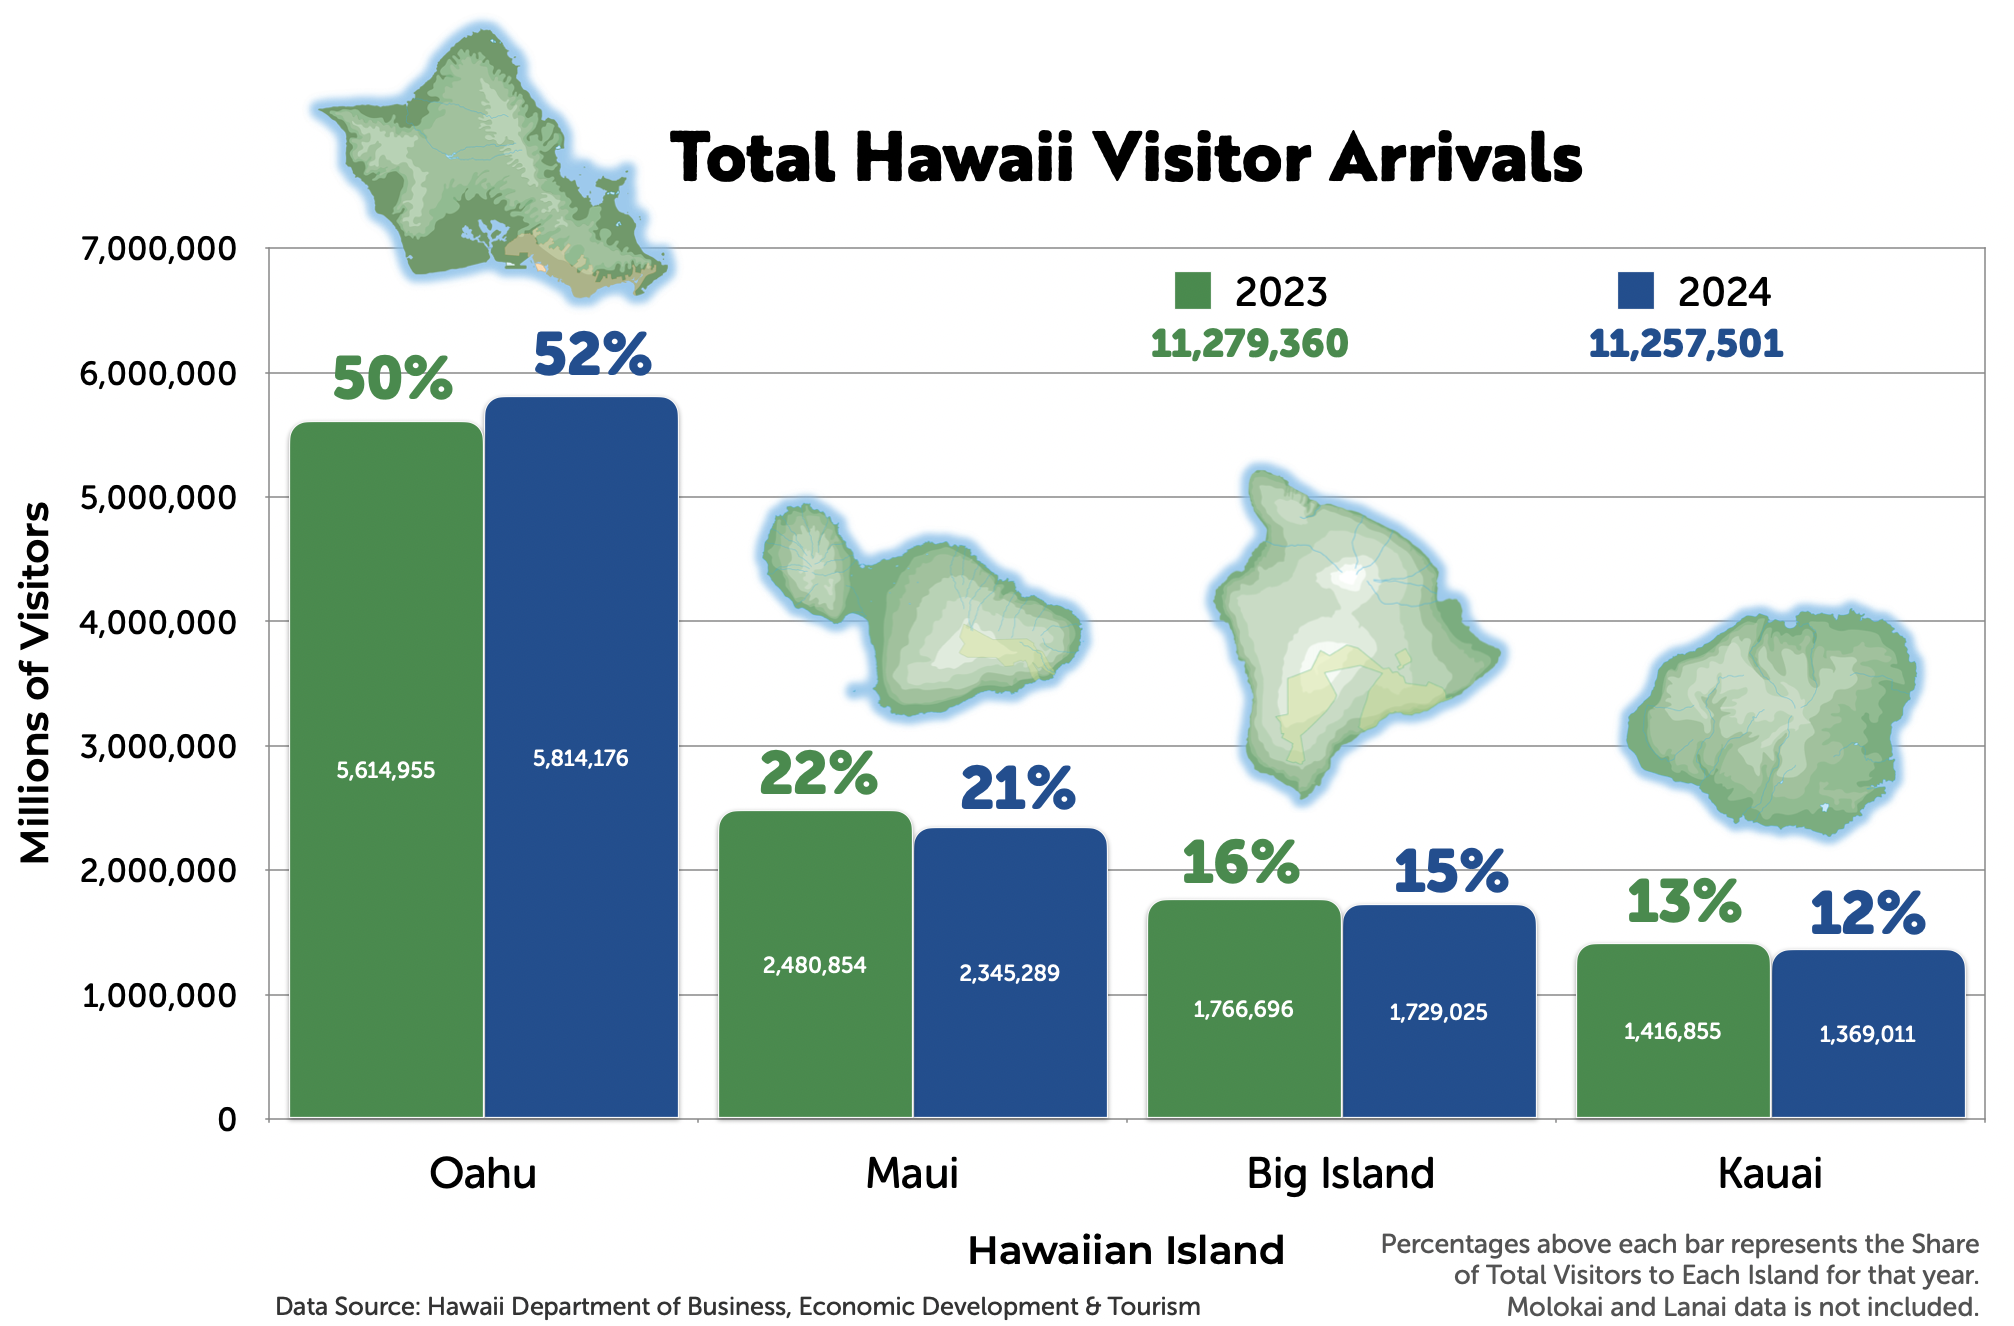
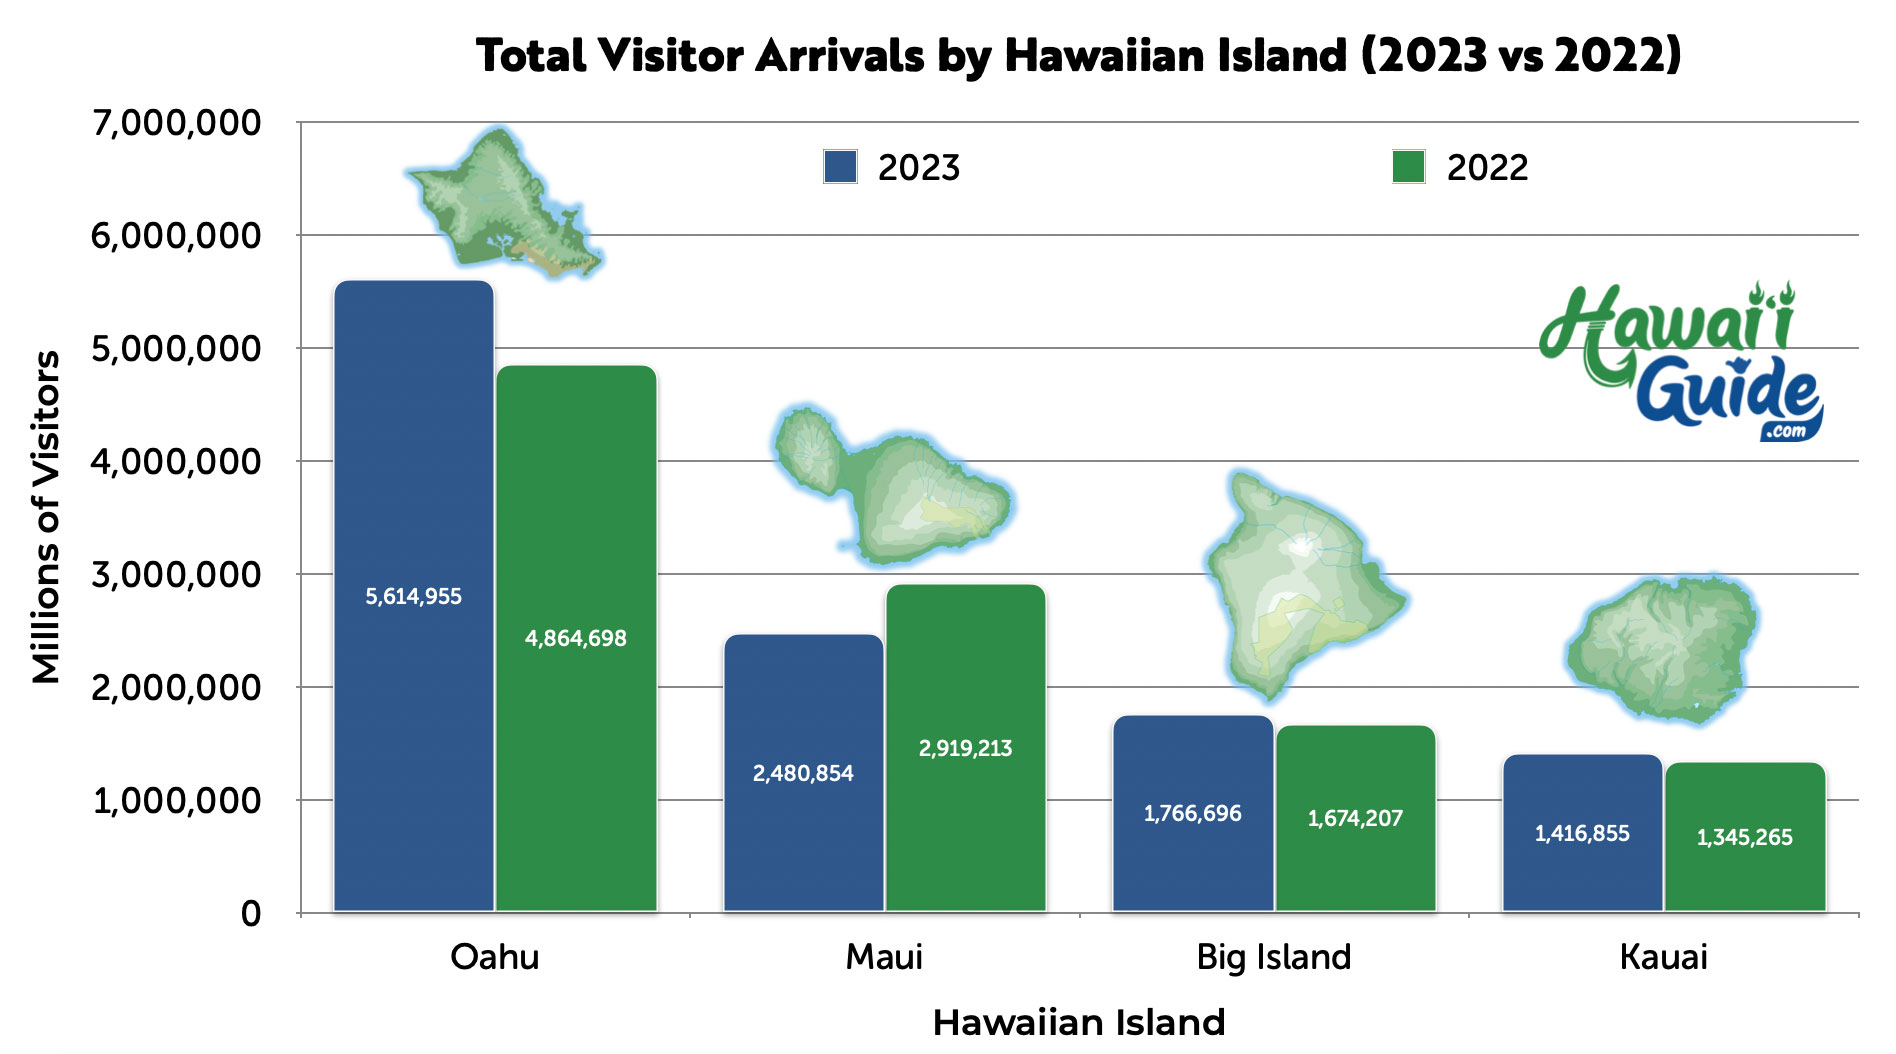
The adjacent graph shows the complete-year 2024 arrival data to each island (including multi-destination/island arrivals). The latest statewide DBEDT release, published May 28, 2026, covers preliminary April 2026 results: visitor spending increased even as total visitor arrivals edged down year over year. You can also view our historical 2023 data graph, 2022 data graph, 2018 data graph, 2016 data graph, and 2006 data graph for comparison.
A pie chart is not truly the best format to display the visitor totals for the various islands as the number of visitors shown in the chart is greater than the true total, as many visitors go to more than one island. However, for our purposes, it should give you an idea of how many visitors (percentage-wise) are arriving/visiting each island. Just keep in mind the actual arrival numbers are "inflated" a bit. A more accurate way to look at this is 'Visitor Days,' per island, but these percentages seen here provide an accurate overview of each island's visitation.
Latest DBEDT snapshot: In April 2026, Hawaiʻi recorded 828,959 total visitors, down 0.5% from April 2025, while visitor spending rose 4.8% to $1.77 billion. Through the first four months of 2026, total visitor spending reached $7.89 billion, up 8.0% year over year, and arrivals reached about 3.38 million, up 2.7%. DBEDT notes that April 2026 air-service statistics are limited because of a data-processing delay, with more detailed statistics expected in upcoming releases.
Total Visitor Arrivals by Island
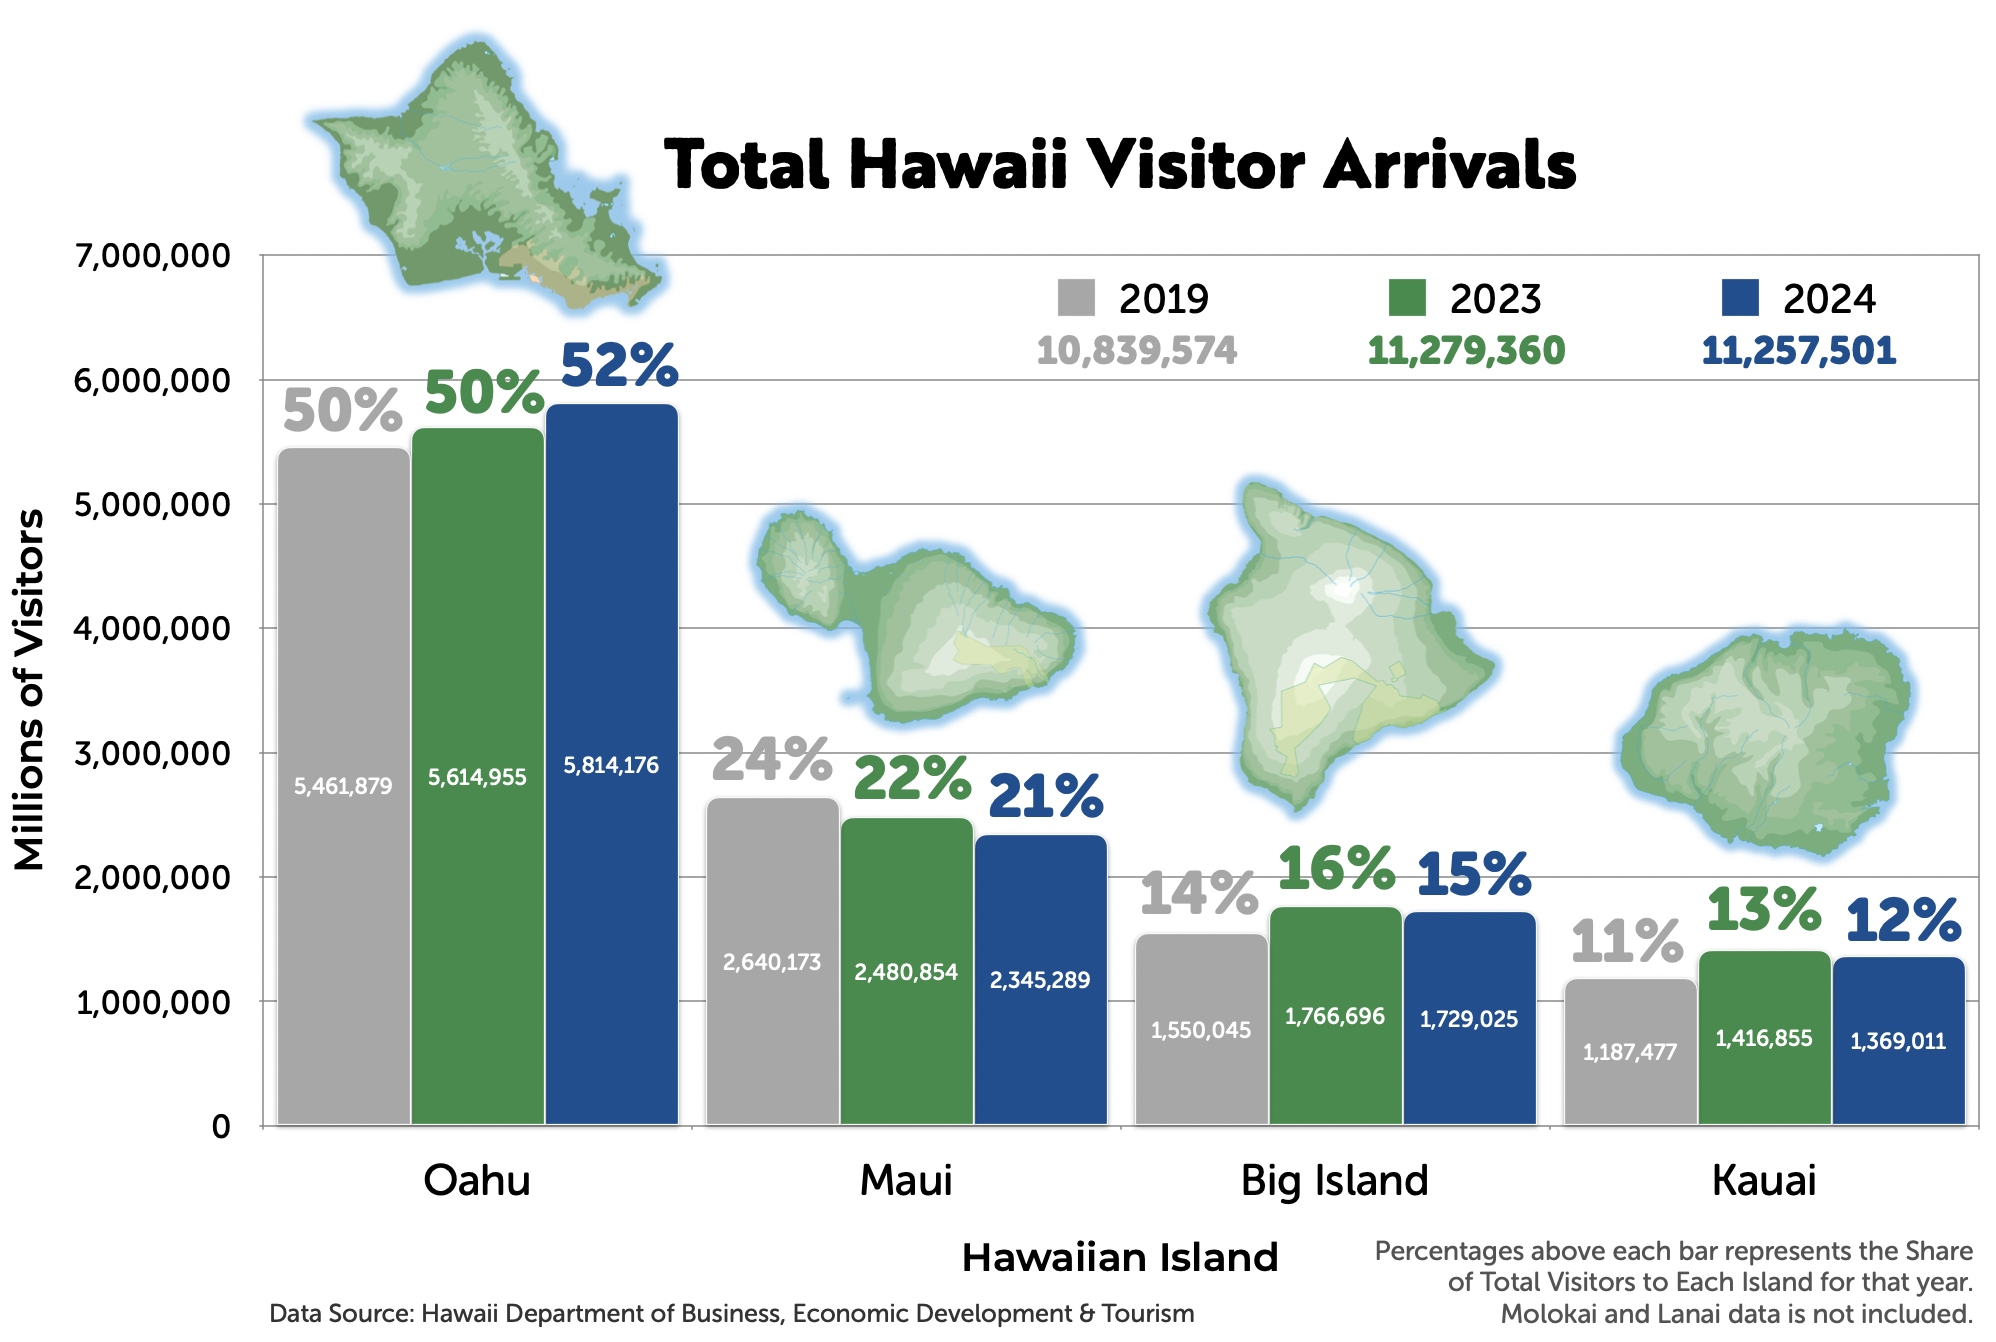
Annual Arrivals per Hawaii Island (2024 vs. 2023 vs. 2019)
2026 Hawaii Visitor Data Snapshot
Latest statewide DBEDT release: April 2026 preliminary data
DBEDT's April 2026 visitor statistics show the pattern that matters most for travelers and local businesses: Hawaiʻi is drawing slightly fewer monthly visitors than a year ago, but those visitors are spending more each day.
Visitor Numbers and Spending:
- April 2026: 828,959 total visitors, down 0.5% from April 2025, with $1.77 billion in visitor spending, up 4.8% year over year.
- Year to date: About 3.38 million visitors through April, up 2.7%, and $7.89 billion in spending, up 8.0% from the first four months of 2025.
- Daily spending: Average per-person daily spending reached $278 in April 2026, up 14.1% from April 2025.
Maui’s Recovery:
- Post-Wildfire Rebound: Maui continues its recovery from the August 2023 wildfires. West Maui has reopened to visitors outside restricted Lahaina burn-zone areas, but the pace of recovery is still uneven.
- Economic Impact: The wildfires significantly affected Maui tourism, with visitor arrivals and spending falling sharply after August 2023 before improving through 2024 and 2025. Recovery efforts are ongoing, focused on infrastructure, housing, and restoring visitor confidence without ignoring community needs.
Source-Market Notes:
- U.S. East and Japan: Both recorded year-over-year visitor-arrival growth in April 2026.
- U.S. West: Arrivals declined, but higher average daily spending pushed U.S. West visitor expenditures above April 2025.
- Canada: Arrivals and spending both declined year over year, continuing the softer Canadian-market pattern seen earlier in 2026.
Sustainable Tourism Initiatives:
- Focus on Sustainability: Hawaii increasingly emphasizes sustainable tourism practices, encouraging visitors to engage in eco-friendly activities and supporting local communities. This shift aims to preserve the islands’ natural beauty and cultural heritage for future generations.
The practical takeaway is simple: 2026 is not just a crowd-count story. Arrivals are only part of the picture. Visitor days, daily spending, lodging rates, and island-specific recovery patterns matter more when deciding how crowded, expensive, or easy a trip may feel.
Hawaiian Islands Visitor Demand
Complete-Year Hawaiʻi Visitors by Month (DBEDT, 2023–2025)
The tabular chart shown below gives the breakdown of visitors in the islands on a month-by-month basis, color coded per island. It uses the latest complete-year island series in our chart dataset, while the statewide 2026 release notes above cover the preliminary year-to-date trend.
Visitor Days & Visitor Expenditures
In considering the "health" of the tourism market, one must also put emphasis on the two factors that are the most important: "visitor days" and "visitor expenditures."
Arrival counts alone do not tell the full tourism story. If visitor days and visitor spending rise over the long term, the industry can remain economically healthy even when raw arrival counts are flat or lower. That is why Hawaiʻi planners often focus on visitor days and spending alongside arrival totals.
Why limit arrival counts you might ask? One has to consider tourism "capacities" of the islands and how that will affect future trends. Maui and O'ahu likely reached their carrying capacity (for visitors) years ago, thus have few remaining competitive development opportunities and will not have the statistical fluctuations or upside growth potentials seen on Kaua'i. In fact, due to growth in recent years, Kaua'i has now about reached its own carrying capacity pending completion of on-going development.
Hawaii Visitor Graphs

Estimated Hawaii Visitor Arrivals by Month 2024 & 2023

Estimated Hawaii Visitor Arrivals by Month 2023 & 2022
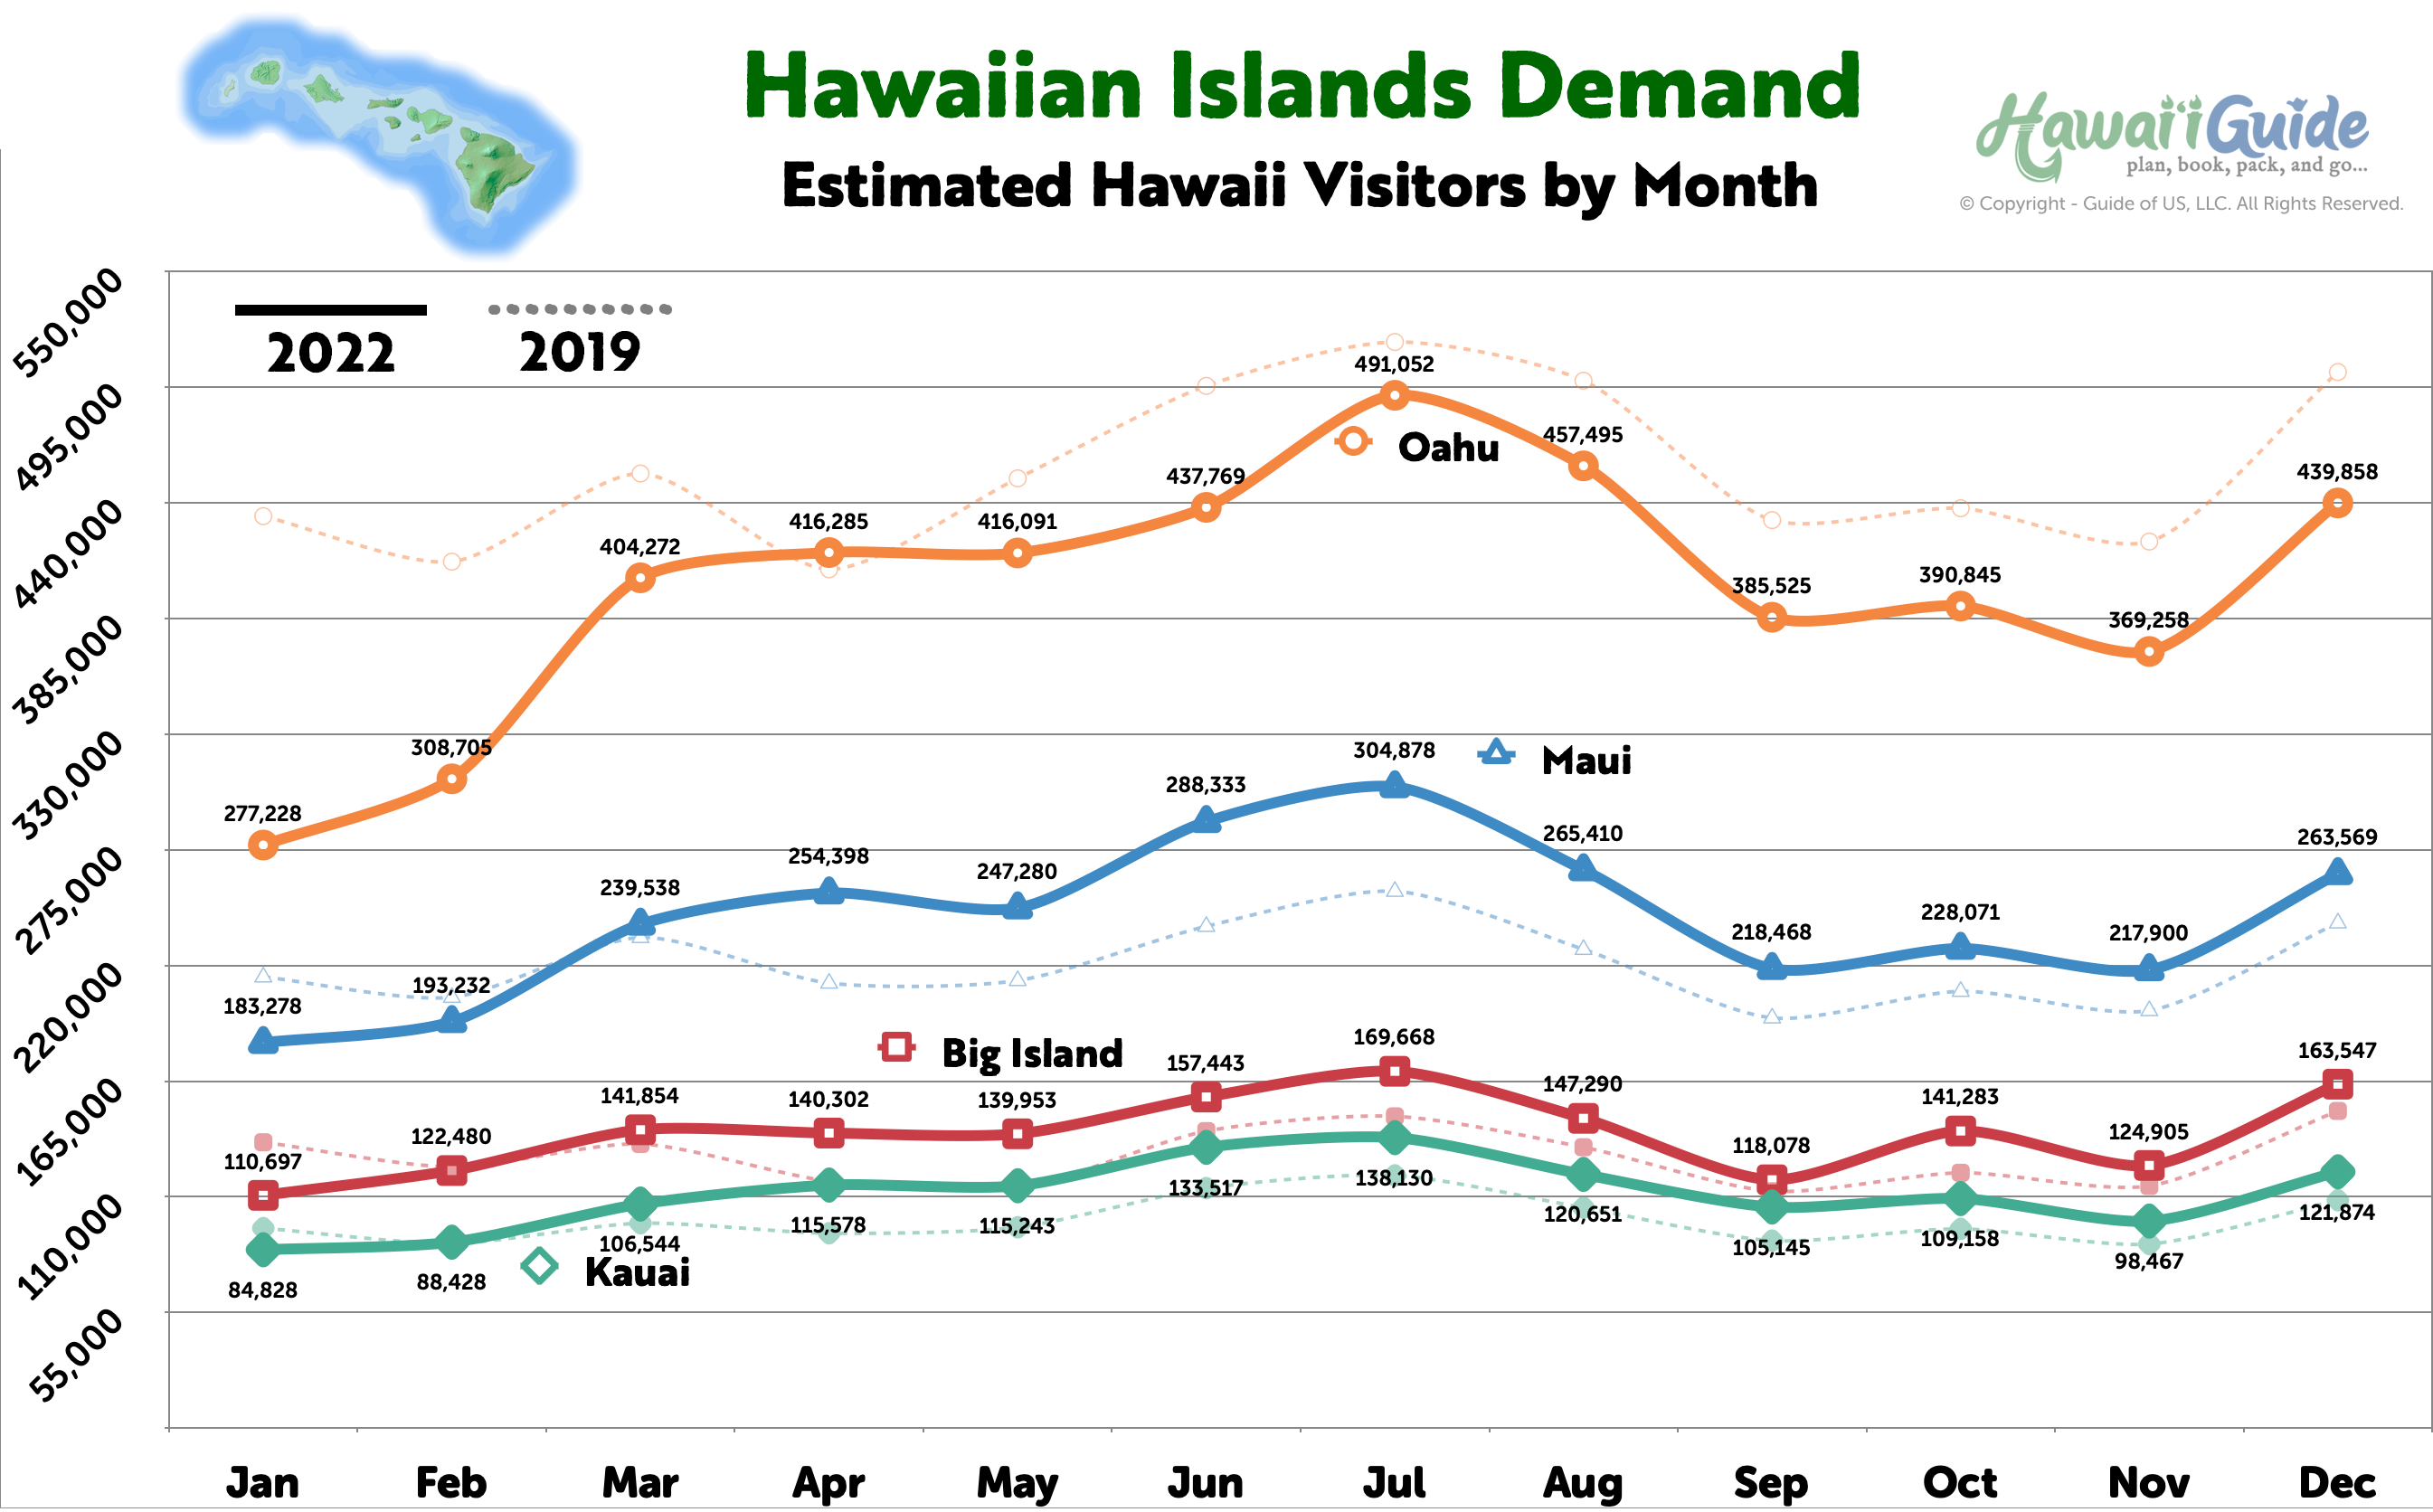
Estimated Hawaii Visitor Arrivals by Month 2019 & 2022
Individual Hawaiian Island Data
These statistics are "arrival" data - meaning visitors who arrived in the islands (either from the mainland US, abroad, or from another island).
When viewing these statistics, we encourage visitors to keep the geographic size of the islands in mind. For example, the Big Island and Kauai have very similar trends in arrivals. However, the Big Island is significantly larger geographically speaking than Kauai (in fact, it is larger than all of the other islands combined) so these visitor numbers alone cannot tell the complete story. Kauai and the Big Island may very well have the exact same number of visitors any given month, but the size of the island will also determine how "crowded" it feels.
Big Island of Hawaii Visitor Data
The largest in the chain typically averages between 130,000-175,000 arrivals each month. Excluding the summer "hump" felt through all the islands, the number of arrivals fluctuates much less than some other islands in the chain, so visitation is usually about the same in Hawai'i. The events we noted on the best time to travel to Hawaii page, that are held each spring and fall, can increase visitor ratios on the island. The volcanic eruptions that periodically occur are also likely to impact travel numbers to the Big Island at any given time.
Maui Visitor Data
The second largest island in the chain typically ranges between 150,000-225,000 arrivals each month. The summer "hump" is by far the largest period of arrivals, but there are also significant spikes at other times during the year, most notably around the Christmas holidays. The reopening of West Maui, excluding historic Lahaina Town following the devastating wildfires in August 2023, has positively influenced arrival numbers. Generally, however, we believe Maui visitor numbers will be recovering from large declines following the fires for an extended time.
Kauai Visitor Data
The fourth largest island in the chain typically ranges between 100,000-130,000 visitors each month. Kauai, in general, is a much quieter island (arrival wise) when compared to the likes of the other islands in the chain. But that may be due to its size and "theme" (all things green). The summer "hump" is the only really busy time on the island, though it's not as distinct as the "hump" Maui and Oahu experience. As a side note, the occasional winter and spring storms and subsequent Kauai closures will likely impact visitor arrivals after this period.
Oahu Visitor Data
The third largest island in the chain typically ranges between 450,000-560,000 visitors each month. As you can quickly see, that number significantly dwarfs the other islands' arrival data. Oahu is widely popular with visitors abroad, and given that roughly 70% of the state's population lives on this single island, the arrival data can skew accordingly. The island's diverse attractions, from the bustling city of Honolulu to the historic sites of Pearl Harbor and the scenic North Shore, continue to draw the most visitors among the Hawaiian Islands.
Typical Hawaii Visitor Timeline

Typical Visitor Planning Timeline
More Information:
Hawaii Weather page or Selecting a Hawaiian island to visit
If you want even more detailed tourism statistics, please visit the Hawaii Department of Business, Economic Development & Tourism visitor statistics hub.
Molokai & Lanai Visitor Data
These two islands only make up slightly more than 1% of all visitor arrivals combined. If you're heading to either of these two islands and are curious about this data, we suggest you look at the detailed statistics provided through the DBEDT visitor statistics hub.