

Hawaii Weather
Current Forecasts & Climate Patterns in Hawaii
While it's always going to be close to impossible to predict the weather months or even weeks ahead of your vacation, it’s helpful to look at Hawaiian weather trends to get an idea of what to expect before you travel to Hawaii. Hawaii weather is about as sporadic as it gets. Forecasting the weather on Hawaii can be both daunting and confusing to visitors - this isn't the mainland, and the climate takes some getting used to.
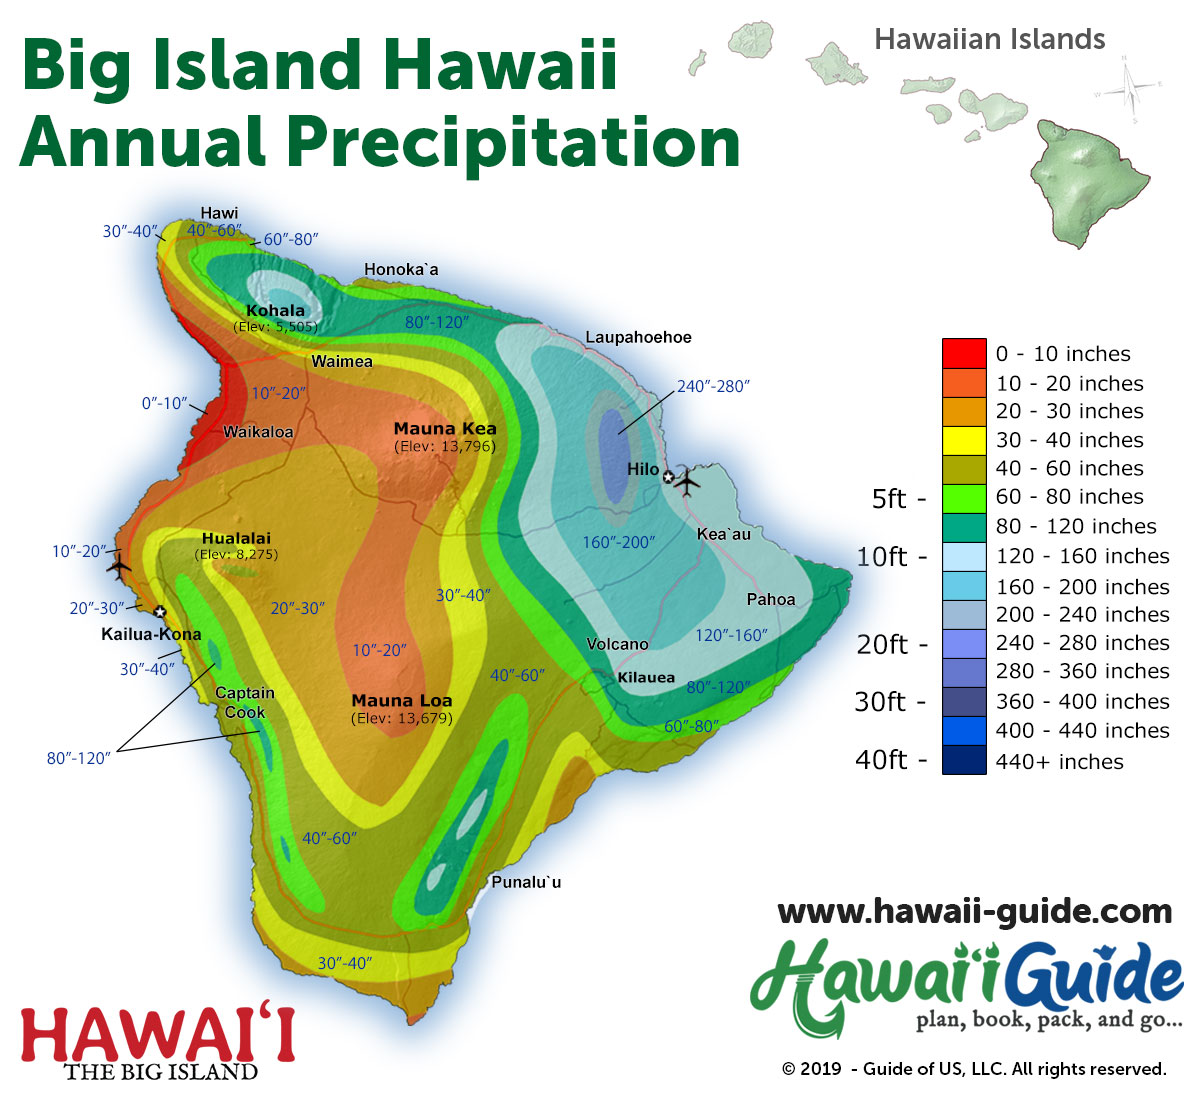
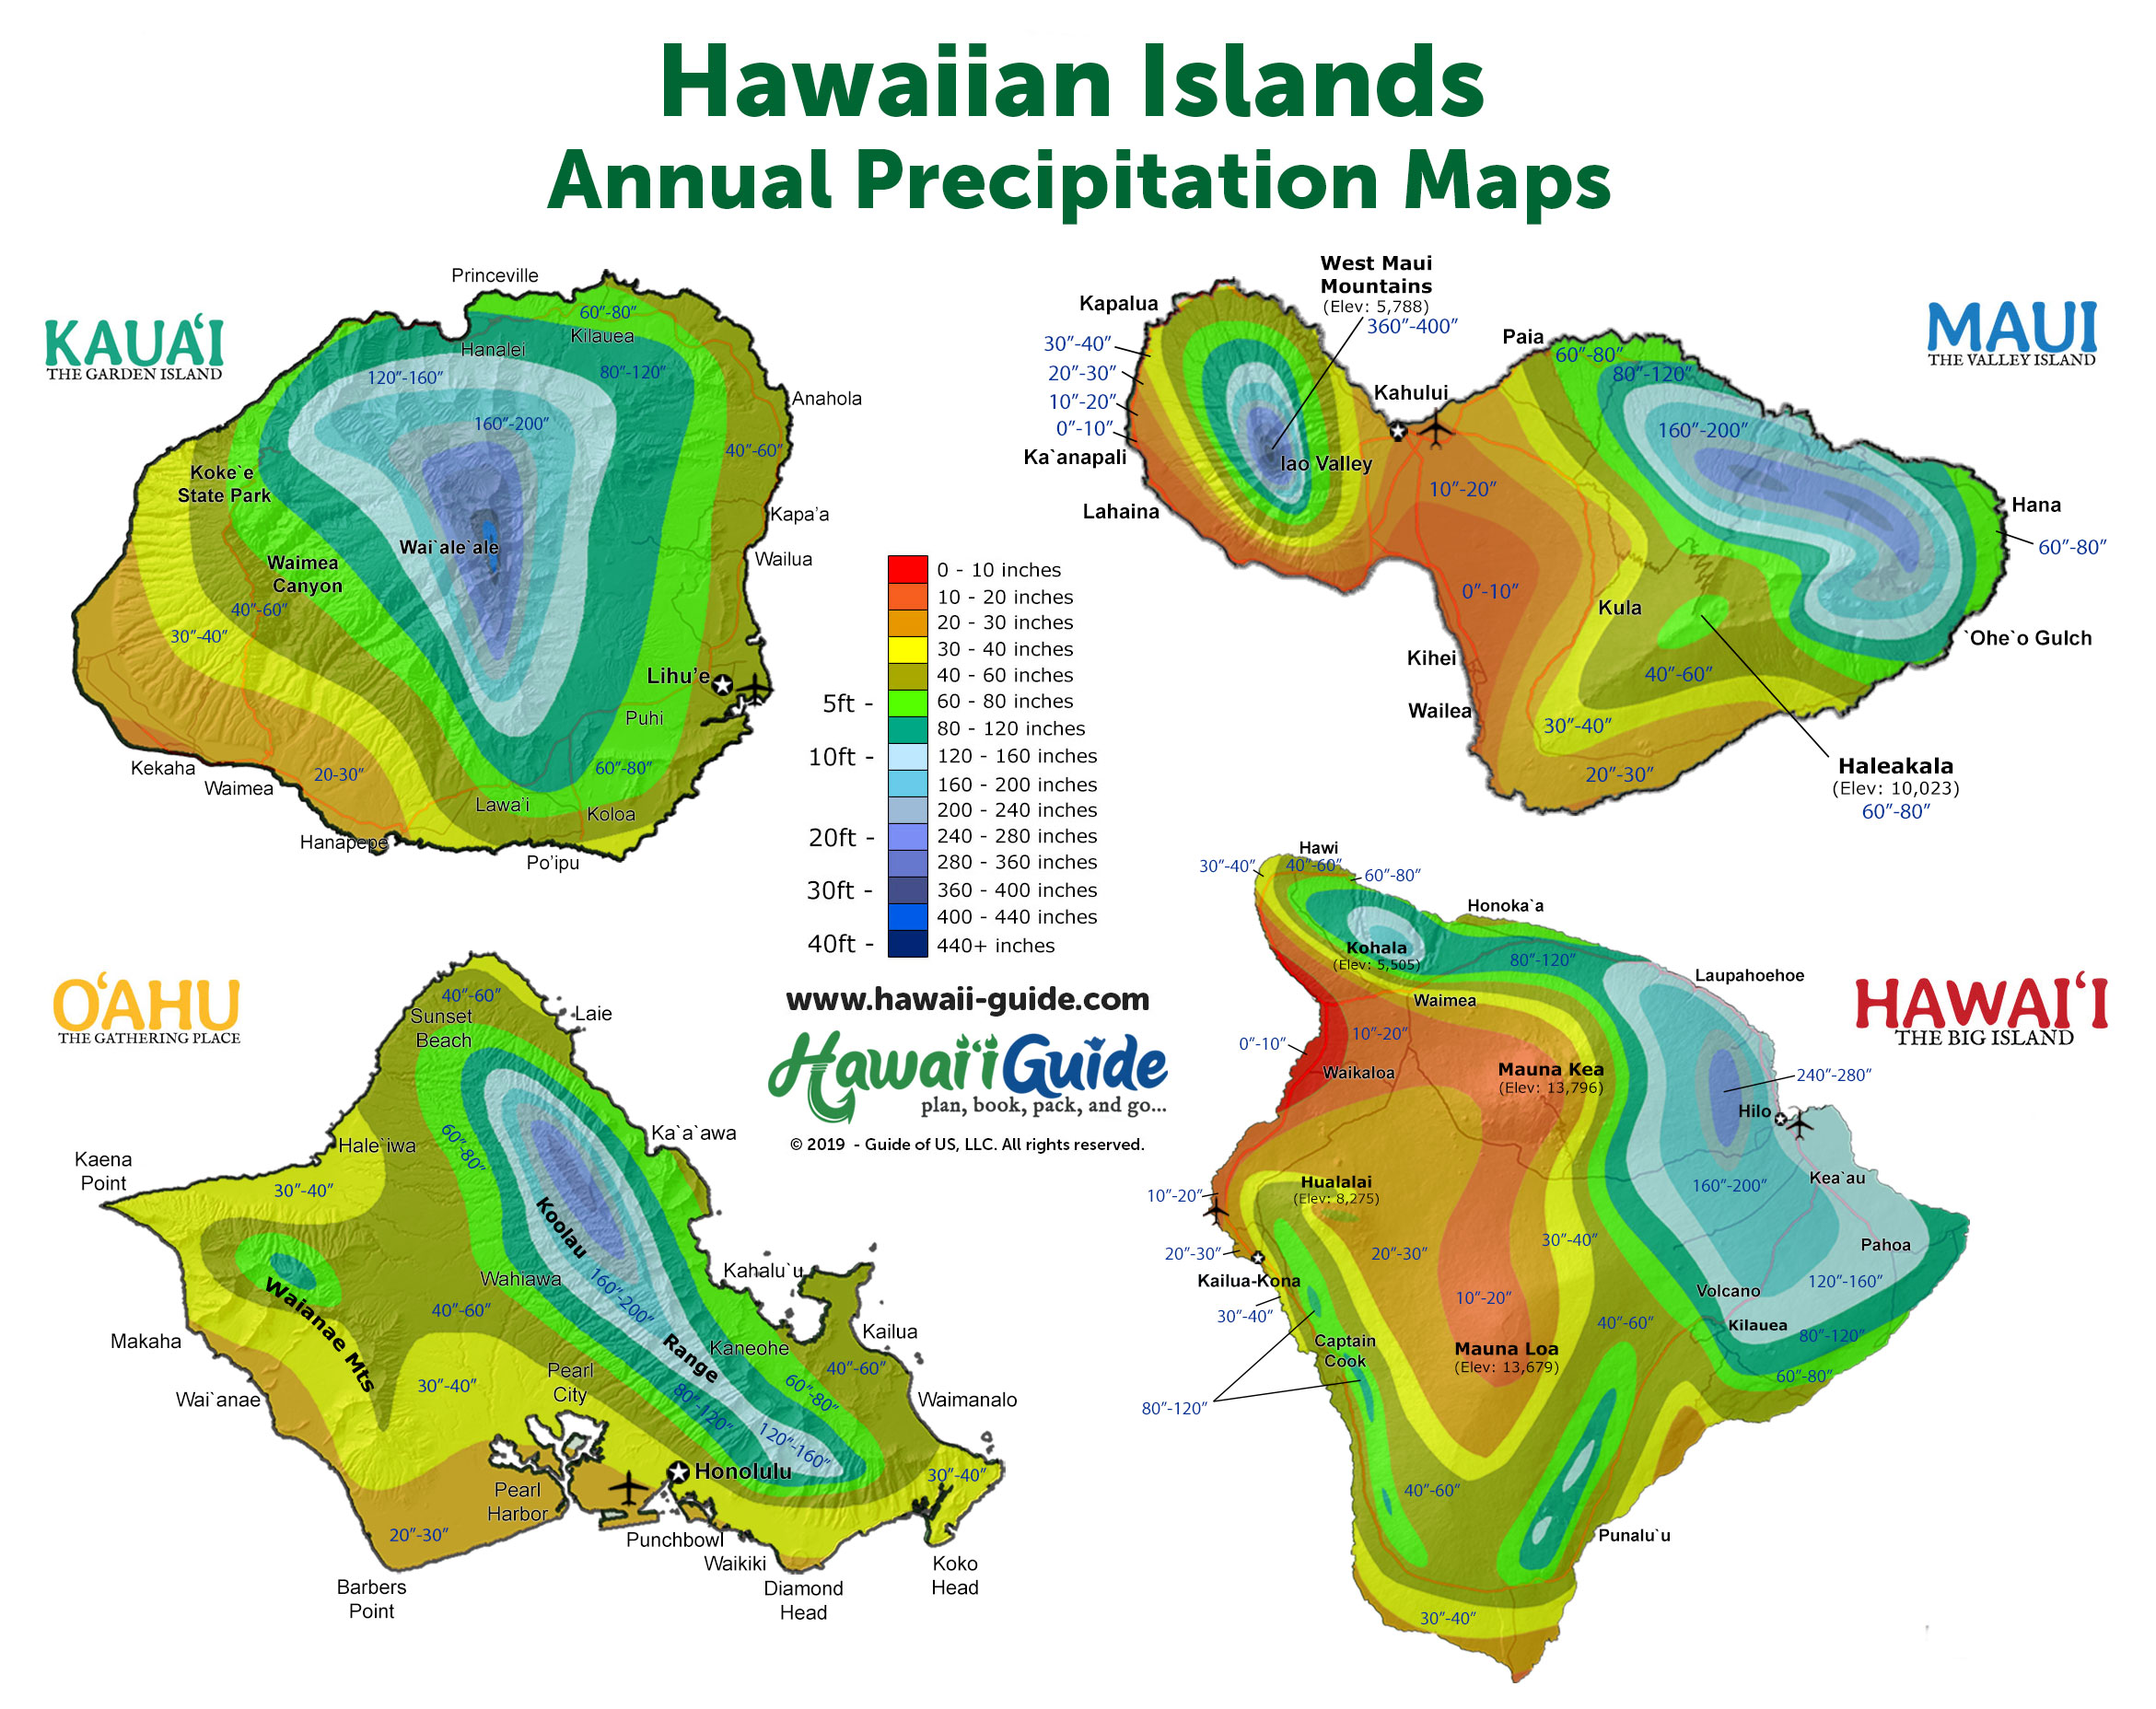
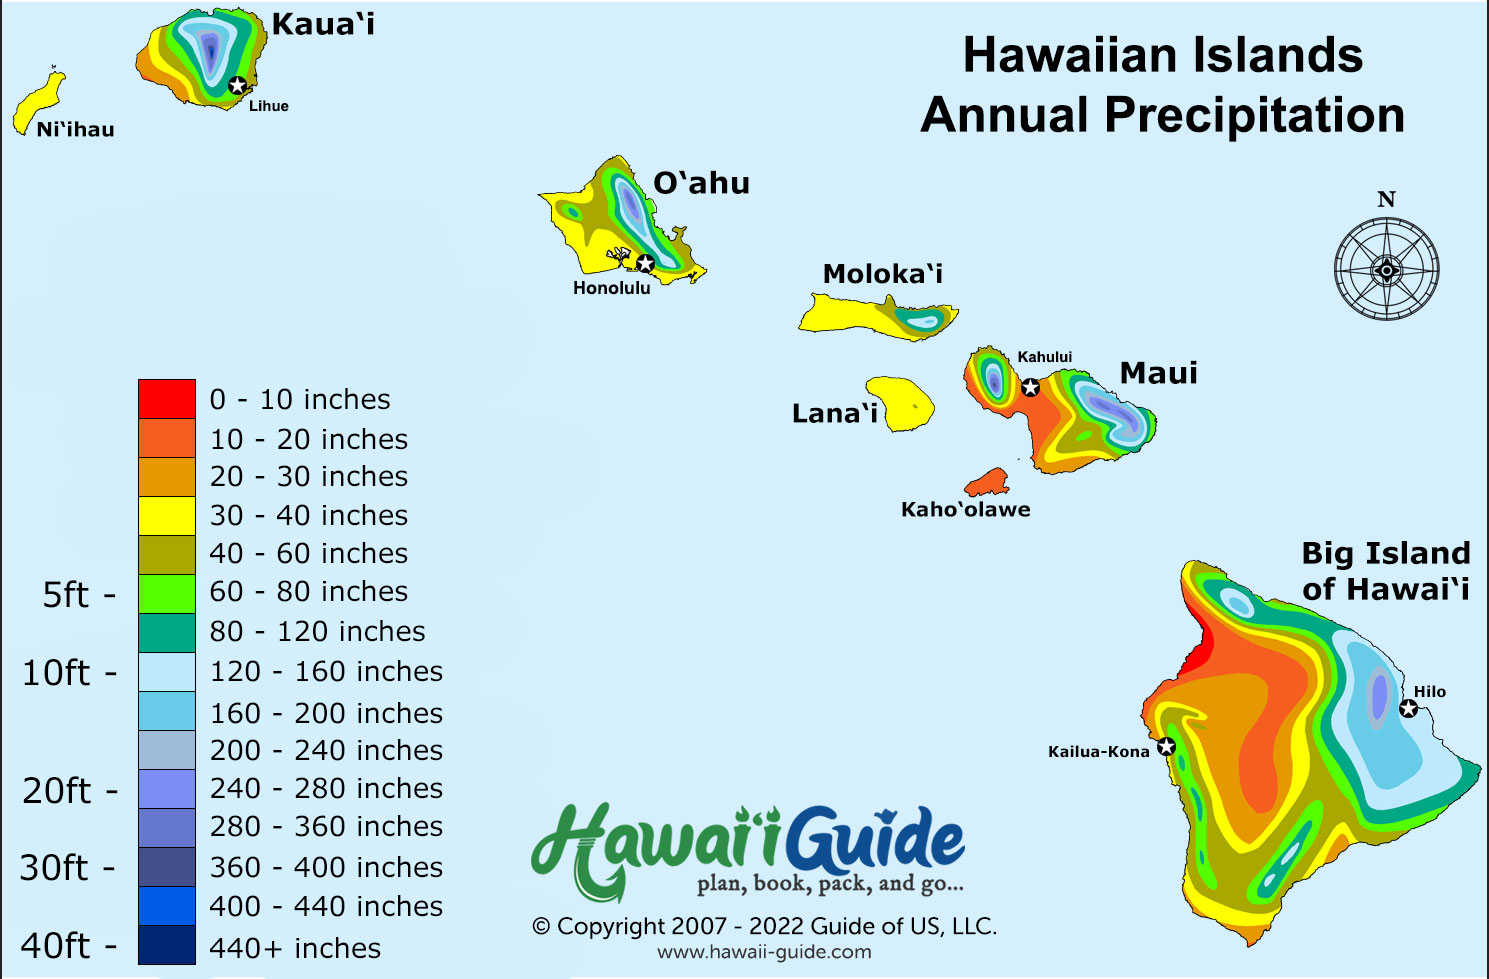
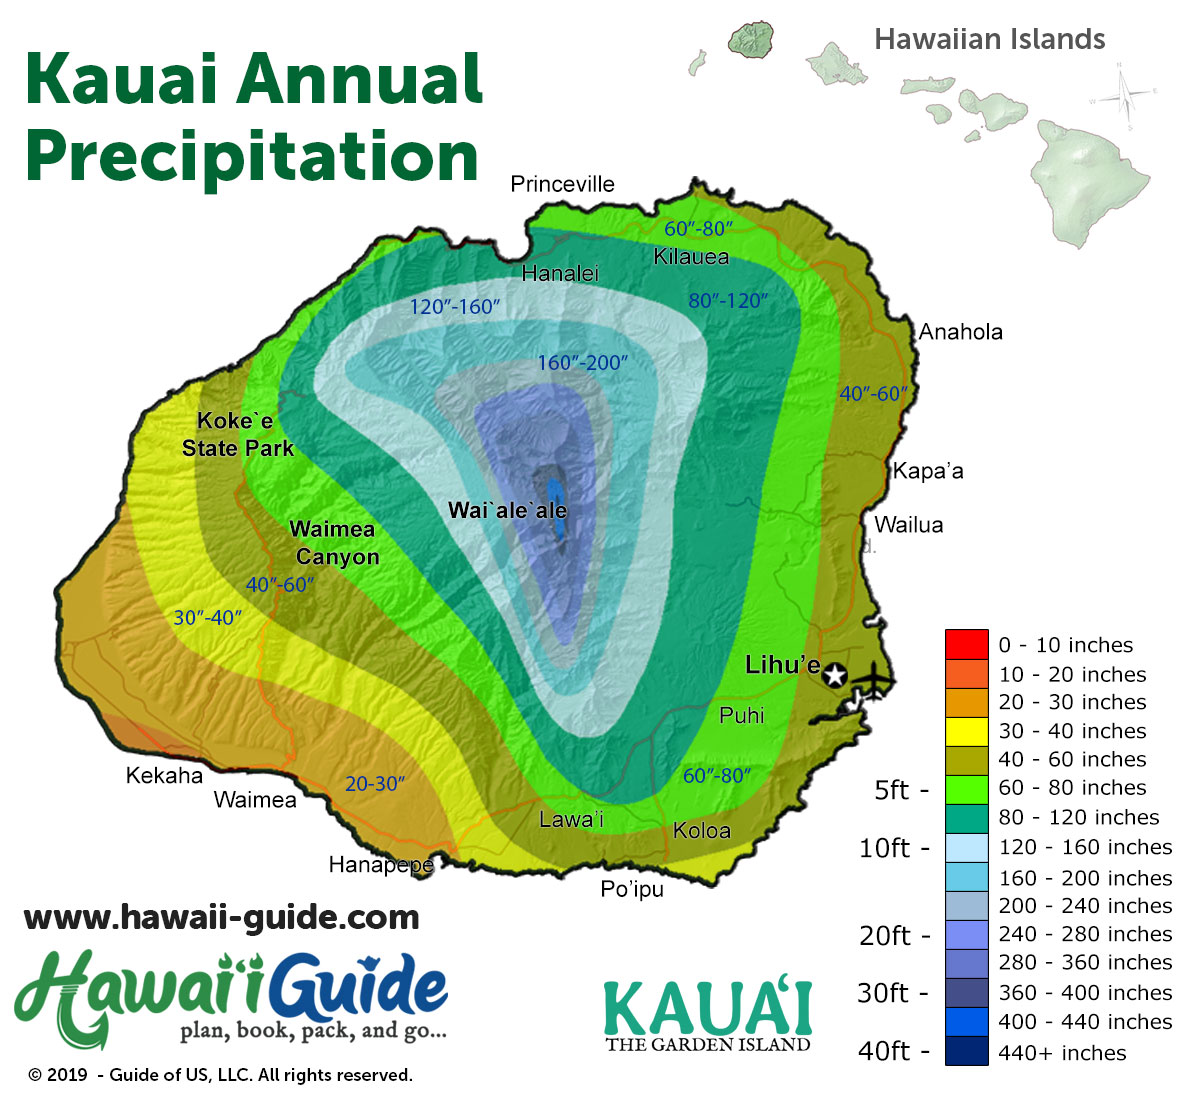
One minute it's raining and the next the sun's out - welcome to the tropics! Keep in mind that the weather is diverse here because the topography is also diverse. The Big Island alone spans an unusual range of climate zones. Kauai's Wai'ale'ale is one of the world's wettest places, with annual rainfall measured in the hundreds of inches, while Hilo on the Big Island receives well over 100" in many years. Sounds pretty wet right? But lest we forget that just a few miles southwest of the wettest areas, the Kekaha area of Kauai is dramatically drier; quite the contrast! Don't let the wet locations and/or cities fool you, it can be plenty dry in Hawaii on the Leeward side of the islands.
Use this guide for long-term weather patterns, then check the National Weather Service forecast and warnings for the place you plan to visit. A rain icon does not tell you how long a shower will last. Some showers pass quickly; storms can bring prolonged rain and flooding. Do not dismiss a warning because a coast is usually dry.
Live Hawaii Weather Forecast
Real-time conditions, 7-day forecasts, and microclimate data for Oahu, Maui, Big Island, and Kauai.
View Live ForecastDetails on Hawaii Weather, Climate, Forecasts, and much more...
- General Weather Patterns in Hawaii
- Hawaii Climate & Long-Term Weather Trends
- Year-Round Temperatures you can expect in Hawaii
- Learn about how El Nino and La Nina affect Hawaii, including our 2026 El Nino Hawaii weather outlook
- Information about Hurricane Season in Hawaii
- Kauai Weather - including Garden Isle weekly forecast, rainfall and temperature graphs, and precipitation map.
- Oahu Weather - including Honolulu weekly forecast, rainfall and temperature graphs, and precipitation map.
- Maui Weather - including Valley Isle weekly forecast, rainfall and temperature graphs, and precipitation map.
- Big Island Weather - including Kona & Hilo weekly forecast, rainfall and temperature graphs, and precipitation map.
- Additional Weather Graphics for the Hawaiian Islands
Hopefully, the Hawaii weather graphics found throughout this article and our brief introduction to the weather here in the Hawaiian Islands will help you plan an enjoyable visit.
Get Your Free Hawai'i Guide
Instant access — opens immediately
- Beaches, activities & top spots
- Restaurant & dining recommendations
- Maps, itineraries & insider tips
Want the full offline version? Get the Complete Hawai'i Guidebook →
Monthly Hawaii Airport Climate Averages
Each month shows the normal daily high / low temperature and monthly precipitation at the named airport station. These are 1991–2020 climate averages, not forecasts or whole-island averages. Scroll across the table to see every month.
| Airport location | Jan | Feb | Mar | Apr | May | Jun | Jul | Aug | Sep | Oct | Nov | Dec |
|---|---|---|---|---|---|---|---|---|---|---|---|---|
| Honolulu, Oʻahu Airport station · USW00022521 |
80.5 / 66.8°F 1.84 in. | 80.5 / 67.1°F 1.94 in. | 81.2 / 68.1°F 2.36 in. | 83.1 / 70.1°F 0.77 in. | 84.8 / 71.5°F 0.82 in. | 86.9 / 73.8°F 0.50 in. | 88.1 / 75.1°F 0.52 in. | 88.8 / 75.6°F 0.84 in. | 88.4 / 74.8°F 0.88 in. | 86.9 / 73.9°F 1.51 in. | 84.1 / 71.8°F 2.25 in. | 81.8 / 69.2°F 2.18 in. |
| Kahului, Maui Airport station · USW00022516 |
82.2 / 63.6°F 2.42 in. | 82.2 / 63.8°F 2.00 in. | 82.9 / 65.1°F 2.64 in. | 84.5 / 66.6°F 1.32 in. | 86.5 / 67.7°F 0.71 in. | 88.3 / 70.3°F 0.17 in. | 89.2 / 71.8°F 0.53 in. | 89.9 / 72.3°F 0.53 in. | 90.0 / 71.2°F 0.45 in. | 88.7 / 70.1°F 0.83 in. | 85.8 / 68.4°F 1.81 in. | 83.3 / 65.9°F 2.80 in. |
| Līhuʻe, Kauaʻi Airport station · USW00022536 |
78.6 / 66.0°F 2.78 in. | 78.1 / 66.2°F 3.63 in. | 78.5 / 67.3°F 5.61 in. | 79.8 / 69.5°F 2.03 in. | 81.6 / 70.9°F 2.18 in. | 83.3 / 73.4°F 1.79 in. | 84.6 / 74.6°F 1.75 in. | 85.2 / 75.2°F 2.33 in. | 85.3 / 74.8°F 2.18 in. | 83.9 / 73.6°F 3.27 in. | 81.2 / 71.3°F 4.03 in. | 79.1 / 68.6°F 4.64 in. |
| Kona, Hawaiʻi Island Airport station · USW00021510 |
81.4 / 68.6°F 1.35 in. | 81.5 / 68.4°F 1.17 in. | 82.2 / 69.7°F 0.97 in. | 83.2 / 71.1°F 0.63 in. | 83.9 / 72.7°F 0.64 in. | 85.2 / 74.0°F 0.76 in. | 86.1 / 74.9°F 0.49 in. | 87.3 / 75.7°F 0.54 in. | 86.9 / 75.1°F 0.54 in. | 86.2 / 74.5°F 0.89 in. | 84.4 / 72.4°F 0.83 in. | 82.3 / 70.0°F 1.06 in. |
| Hilo, Hawaiʻi Island Airport station · USW00021504 |
78.7 / 64.1°F 7.86 in. | 78.4 / 64.1°F 10.22 in. | 78.5 / 65.2°F 12.68 in. | 79.0 / 66.1°F 9.40 in. | 80.7 / 67.3°F 6.99 in. | 81.8 / 68.7°F 7.30 in. | 82.8 / 69.9°F 9.24 in. | 82.9 / 70.4°F 11.30 in. | 83.3 / 69.8°F 8.70 in. | 82.4 / 69.0°F 10.24 in. | 80.3 / 67.6°F 14.39 in. | 78.8 / 65.7°F 12.07 in. |
Source: NOAA NCEI monthly normals, checked September 15, 2026 (UTC). Values retain NOAA's published precision. Rainfall and temperature can differ sharply elsewhere on each island. Use the current forecast and Travel Alerts for daily plans.
General Weather Patterns
The best thing about Hawaii's weather is that it is very localized. You may be driving along the island and be in a rainstorm one minute and in bright sun the next. This variety of weather allows you to fully experience Hawaii and its sun-drenched beaches, misty rainbow-filled valleys, pristine waterfalls, cool highlands, and lush mountains.
Here are a few additional things to keep in mind, summarized, about Hawaii's weather:
- Check our live Hawaii weather forecast before you visit and during your stay; it summarizes current conditions and 7-day island forecasts in plain language.
- Take the National Weather Service forecast and warnings seriously. Local showers do not always mean a day of rain, but there is no ten-minute limit. Check the forecast for your destination before a hike or long drive, and change plans when warnings or closures affect your route.
- As far as temperature goes, plan accordingly for the island you're visiting. At sea level, daytime temperatures are usually in the upper 70s to mid-80s°F year-round. Nights are cooler, but the difference changes dramatically depending on your altitude. Volcano, on the Big Island, or Kokee on Kauai, can get quite chilly at night for example. If you're planning to go up to higher elevations on either Maui or the Big Island, bring a small coat and long convertible pants. It can get very cold at the summit of the larger volcanoes - trust us on that!
Hawaii's usual trade winds blow from the northeast. They are generally more persistent in summer; winter fronts and Kona storms can interrupt them. As moist air rises over windward slopes, it cools and produces clouds and rain. Southerly Kona winds can bring a different weather pattern. The National Weather Service climate summary explains these seasonal and terrain effects.
Hawaii does have a seasonal rainfall pattern: winter is generally wetter and summer drier. The contrast is strongest in many leeward areas, which receive much of their rain from winter storms. Wet windward areas also receive trade-wind showers, so their seasonal contrast is smaller. These are long-term climate patterns, not a guarantee about your travel dates.
Use climate averages to choose a base and pack. Use the current forecast and Travel Alerts to decide what to do today. A flexible itinerary helps; dismissing a warning does not.
Hawaii Climate Patterns
Long-Term Weather Trends
The National Weather Service describes summer as generally drier and winter as the season of more frequent rainstorms. Windward slopes and leeward lowlands can have very different rainfall even on the same island.
Do not choose a beach or trail solely because it is on a southern coast. Terrain, wind direction, and the day's weather matter. Pack rain protection for outdoor plans and check the forecast for the actual location, including its elevation.

Big Island's Rainbow Falls in summer (left) and winter (right) - due to seasonal rainfall differences.
Hawaii Year-Round Temperatures
The National Weather Service climate summary describes mild temperatures throughout the year and cooler conditions at higher elevations. The monthly airport normals table provides temperature and precipitation averages for the five listed stations, not a forecast for your dates.
Temperatures generally fall with elevation. The National Weather Service climate summary gives about 3°F per 1,000 feet as a broad guide, not a forecast for a summit. Check conditions for Haleakalā or Mauna Kea separately from the beach forecast, and pack warm layers.
High summits can have snow, ice, and dangerous weather. Follow current access restrictions and summit forecasts rather than assuming a season is safe or unsafe. Cooler upland locations may also call for a jacket, especially around dawn or after sunset.
Ocean temperatures near Hawaii are usually in the mid-70s°F in late winter and near 80°F in early fall, according to the NWS climate summary. Water temperature does not tell you whether swimming is safe. Check surf, currents, water-quality advisories, and lifeguard guidance.
El Niño and La Niña effects on Hawaii
These two weather systems/events have an impact on the islands. During El Niño winters, the islands are typically drier. Whereas in La Niña years, rainfall in Hawaii has tended to be near to above normal during the winter months. The rainy season has also lasted longer into the spring during La Niña years. Hawaii may receive above-normal rainfall not only during the normally wet period of January through March but during a strong La Niña period, the excess wetness may continue through May in many locations.
NOAA's September 10, 2026 outlook says El Niño is strengthening, with a greater than 90% chance of a very strong event during fall and winter 2026–27. Seasonal tendencies do not predict the weather for a particular island or travel date, and a drier outlook does not rule out a damaging rain event. Read our 2026 El Niño Hawaii weather outlook and El Niño winter guide for planning context; use current NWS forecasts for your trip.
Hurricane Season in Hawaii
Central Pacific hurricane season runs June 1 through November 30. Landfall is only one measure of a storm: damaging rain, wind, and surf can reach an island while the center remains offshore.
2026 storm context: NWS documented an extended period of severe rain and flooding in March. In September, state officials reported Lowell-related electrical damage, road disruption, and other impacts, especially on Kauai. These events are reminders to check current conditions even when monthly averages look favorable. Use Hurricane Alerts and recovery guidance for tropical systems and Travel Alerts for location-specific restrictions; neither an offshore track nor a clearing forecast proves that a destination has reopened.
John C. Derrick's Environmental and Physical Geography background included undergraduate research assistant work with University of South Carolina climatologist Dr. Cary J. Mock and experience as a NOAA weather station analyst. That climate and weather-station background informs our hurricane-season coverage: direct hits remain rare, but visitors should still use official forecasts and build flexibility into late-summer and early-fall plans.
Hawaiian Islands Weather Charts
Use the NOAA monthly airport table for temperature and rainfall comparisons. The island sections below add local context and forecast links. Airport averages do not describe every beach, valley, or mountain on an island.
Kauai Weather, Forecast, & Charts
Kauaʻi's rainfall varies greatly with terrain and exposure. A wet mountain interior does not describe every coastal destination, and a normally dry coast can still flood during a storm. Use the Līhuʻe airport normals as one reference point, then check the forecast for your actual route. Our Kauaʻi weather guide covers local planning.
See the NOAA 1991–2020 monthly airport table for temperature and precipitation averages.
Oahu Weather, Forecast, & Charts
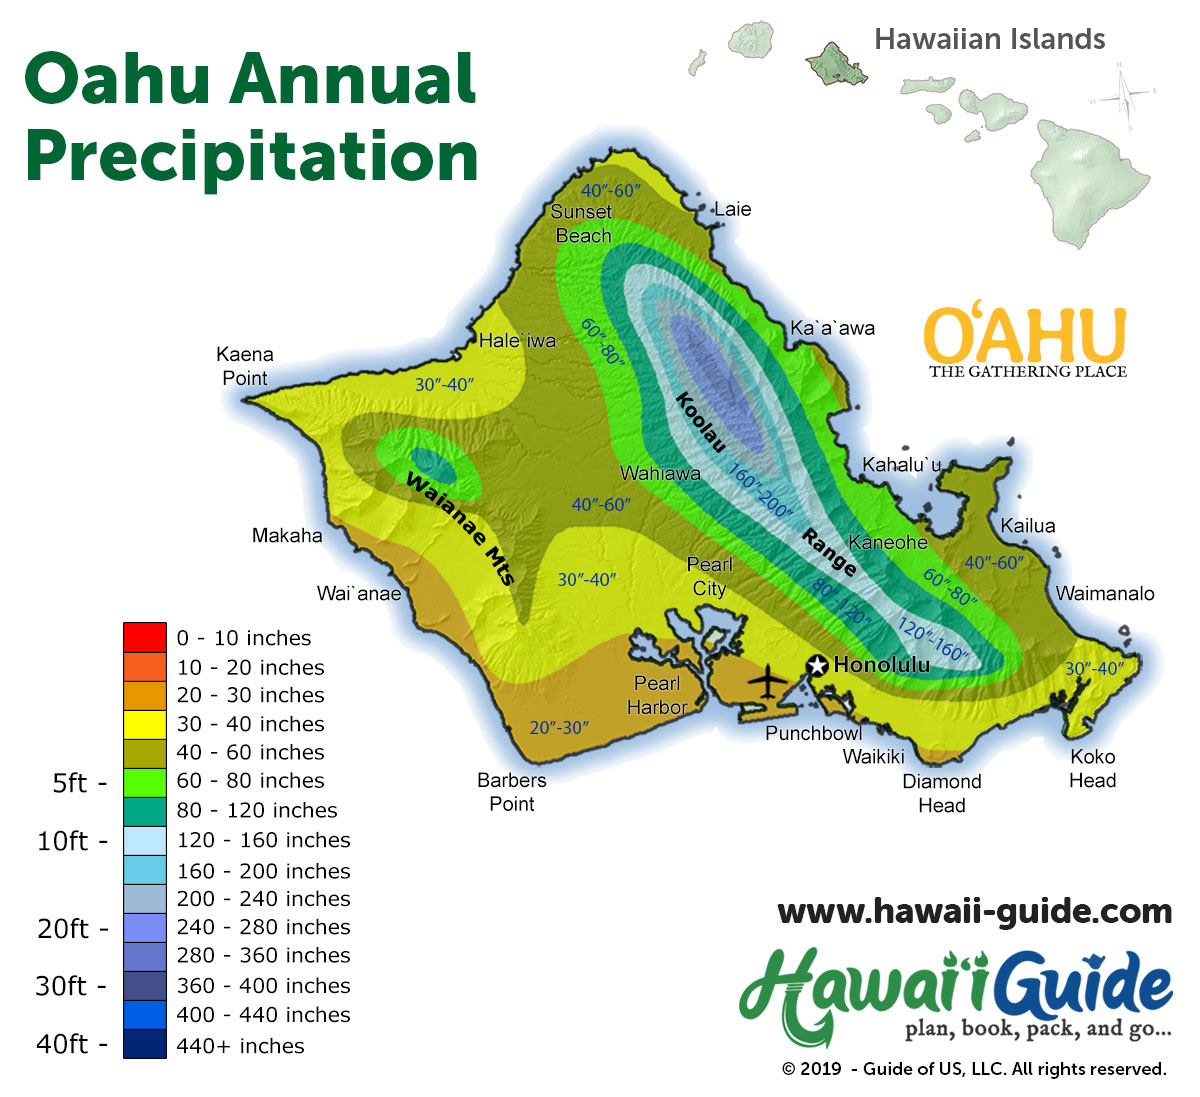
Honolulu and Waikīkī are on Oʻahu's generally drier leeward side, but neither is protected from prolonged rain or severe weather. Conditions on windward slopes can differ from the city. Compare the Honolulu airport normals and use a location-specific forecast before a beach day or hike. See our Oʻahu weather guide for local context.
See the NOAA 1991–2020 monthly airport table for temperature and precipitation averages.
Maui Weather, Forecast, & Charts
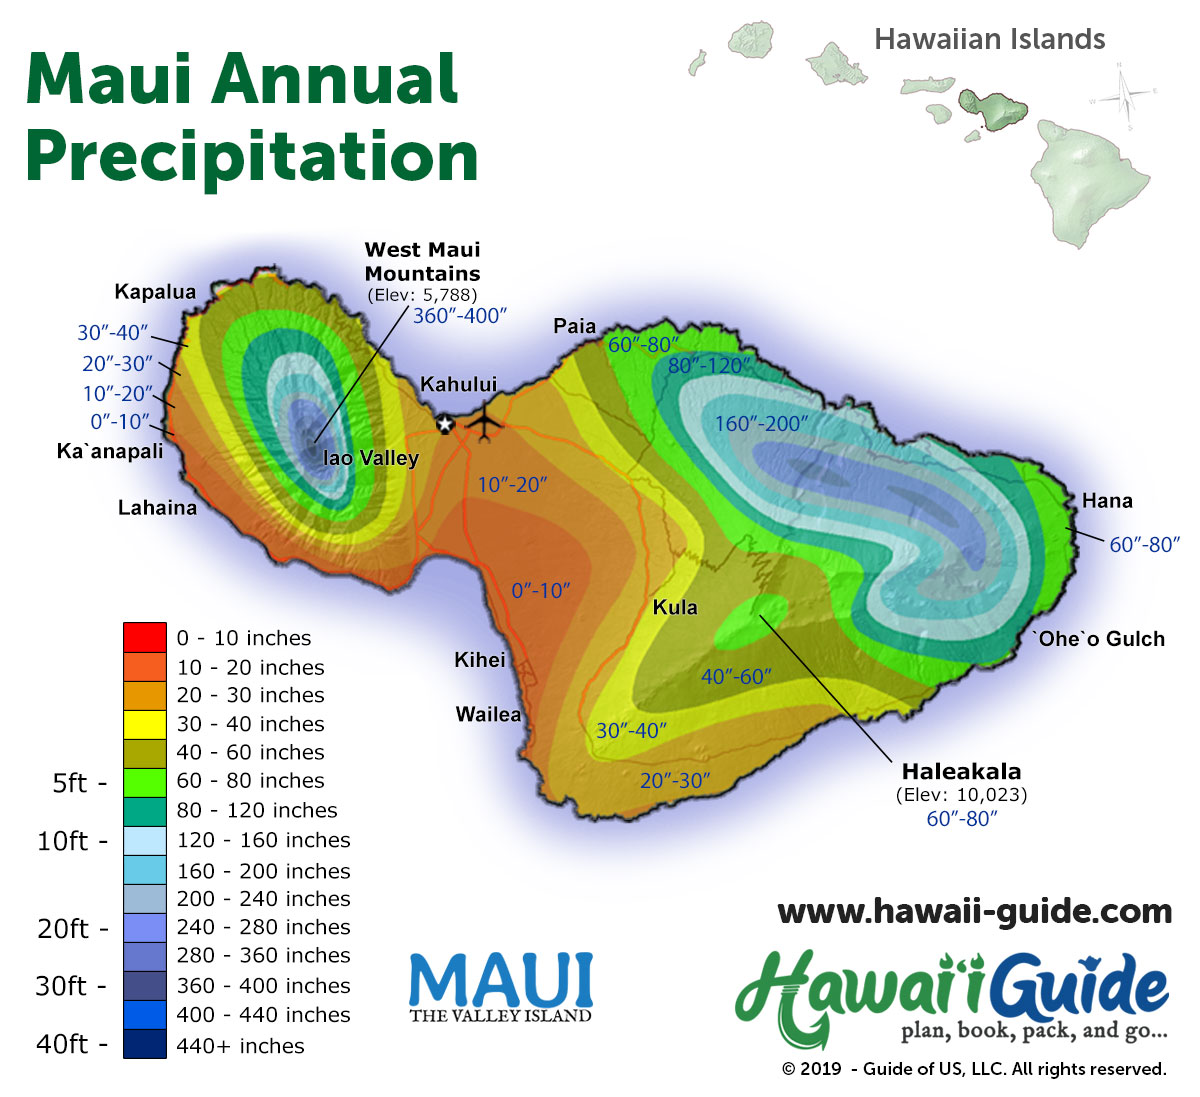
Maui's coastal and upland weather can differ substantially. The Kahului airport normals describe that station, not the weather along the Hāna Highway or at Haleakalā's summit. Check forecasts and road conditions for each part of your itinerary. Our Maui weather guide has more local planning context.
See the NOAA 1991–2020 monthly airport table for temperature and precipitation averages.
Big Island Weather, Forecast, & Charts
Hawaiʻi Island's elevation and exposure create large weather differences. The Kona and Hilo airport normals show two coastal reference points: Hilo receives much more rain in this dataset. Neither station represents the higher elevations around Volcano, Waimea, or the summits. Check the forecast for where you are going, and see our Big Island weather guide for local planning.
See the NOAA 1991–2020 monthly airport table for temperature and precipitation averages.
See the NOAA 1991–2020 monthly airport table for temperature and precipitation averages.